

Investing in the stock market is not new to most of us. While the majority of the investors look at historical data before investing, it is hard for them to quantitatively understand how much return they would get from their portfolio.
In this article, we will look at how successful investors use Python to optimize and diversify their portfolio as well as visualize the correlation between different stocks they own. If you want an expert in python for successful investors in the stock portfolio, then the Intellipaat Python training course is for you.
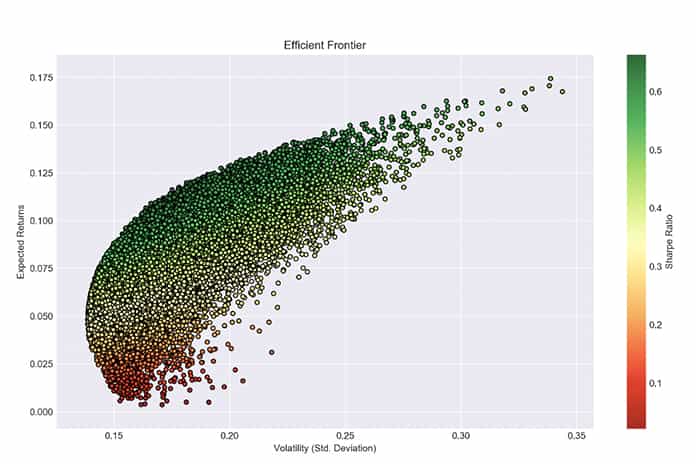
The advantages of using Python to visualize correlation of your stock portfolio are many. The most notable benefit is the creation of an efficient frontier that can then be used to select a specific blend of assets depending on your investment goals.
The Efficient Frontier
According to the Modern Portfolio Theory (MPT), it is possible to construct an “efficient frontier” of your stocks’ portfolio for maximum gains at a given level of risk. The MPT suggests that an investor should not just consider the expected risk and return of only one stock.
Rather, they should diversify their portfolio to reap the benefits and reduce the riskiness of their portfolio.
The Python Advantage
Running a script in Python gives users a complete trading view and important data of each stock, mean daily return as well as the standard deviation of returns.
This data can then be annualized to understand the mean expected return and that stock’s volatility. However, most investor portfolios don’t comprise a single stock, and that is why running a simple script of Python can be of real help in case of stock diversification.
Python correlation with stock is based on the diversification rule, which states that the portfolio’s marginal benefit decreases as the number of stocks increases. What this implies is that the diversification benefit of moving from 1 stock to 2 is a lot more than moving from 2 to 3 stocks and so on.
Therefore, when looking at the stock portfolio, one should not look at the expected return and volatility of each stock collectively, but rather as some information on the stock portfolio.
Looking at the entire stock portfolio helps to understand the benefits of less than perfect correlation among various stocks in the portfolio. To see the correlation of the stock portfolio and for accurately calculating the relative holding period performance, pandas in Jupyter notebook is a good option. Pandas are easily scalable, and it is easy and fast to add new calculations like cumulative ROI multiple while using it.
Data Visualization
For the visualization of data, Plotly is highly effective to generate meaningful insights that are highly reproducible since it allows users to make D3 charts without coding. To create a total return and cumulative return visualizations, follow the steps below:
- Plotly is effective in creating dynamic charts. The first step is to create traces that will plot the x and the y-axis that you mention. In trace1, you need to specify the type of chart you want to plot, with each stock’s ticker on the x-axis and the ticker’s return on the y-axis.
- The next step is to break the data further. Therefore, in trace2, use a Scatter line chart for information related to the ticker on the x-axis and the return you are seeking on the y-axis.
- If the bar is above the Scatter line, then the individual stock has outperformed its return. In case the performance is below the line, the stock is not providing the expected return.
- The next step is to create a data object with the given traces and to specify the layout of the output chart.
- Use go. The figure to create a figure object and mention the data and layout objects.
While this is how you can visualize your stocks using Python, there are a couple of other points to remember, including adjusting the trailing stop. A trailing stop, also known as a trailing stop-loss, is a type of a trade order that investors use to minimize loss.
It is an order that is set stop price at a fixed amount below the market price and has an attached “trailing” stops.
Using a trailing stops means that if the market prices increase, the stop price increases by the trail amount. However, in case if the stock price dips, the stop price loss remains constant. In other words, trailing stops are there to help preserve gains and are usually critical in mitigating the investing emotions.
Therefore, it might be easy to visualize your stock’s current return, but it is somewhat a manual process to calculate how your stocks stack up to your trailing stops. In case you are not happy with the level of volatility of your existing portfolio, how would you increase or decrease it? Or what if you’d like to rearrange the weight of each stock in your portfolio?
You may think of manually changing it, but it can be very time consuming and tedious. Add to it, there is also an infinite number of sets of portfolio weights that can be tested, making the entire exercise impractical.
Luckily, you can use Monte Carlo simulation that can execute thousands of combinations of various randomly generated weights for each stock in your portfolio (obviously ensuring the added weight of all the stocks are 100%).
Monte Carlo Simulation
Using Monte Carlo simulation, traders can calculate the expected return, the expected volatility as well as the Sharpe Ratio for each stock and its randomly generated percentage weight in your portfolio.
With Monte Carlo, it is simple to plot multiple combinations of returns and volatilities and even customize the data points of Sharpe Ratio based on different colors. This gives a complete correlation between multiple stocks in a portfolio.
Creating a visualization based on the weight of each stock and changing the weight can have a dramatic effect on the risk level as well as the expected return.
Final Thoughts
There are several platforms, such as Alpaca that provide the right platform to visualize the correlation of your portfolio using Python. In fact, Alapca encourages commission free trading through their products by enabling anyone to build and connect applications and algorithms to buy and sell stocks .
As you may have noticed, it is really easy and simple to create stock visualizations using Python. Python enables you to have an enhanced understanding of your master data frame, with a special focus on the various metrics and each stock’s contribution to another.
Also Read: Emerging Technologies For Facial Recognition